AI Chatbot Activity
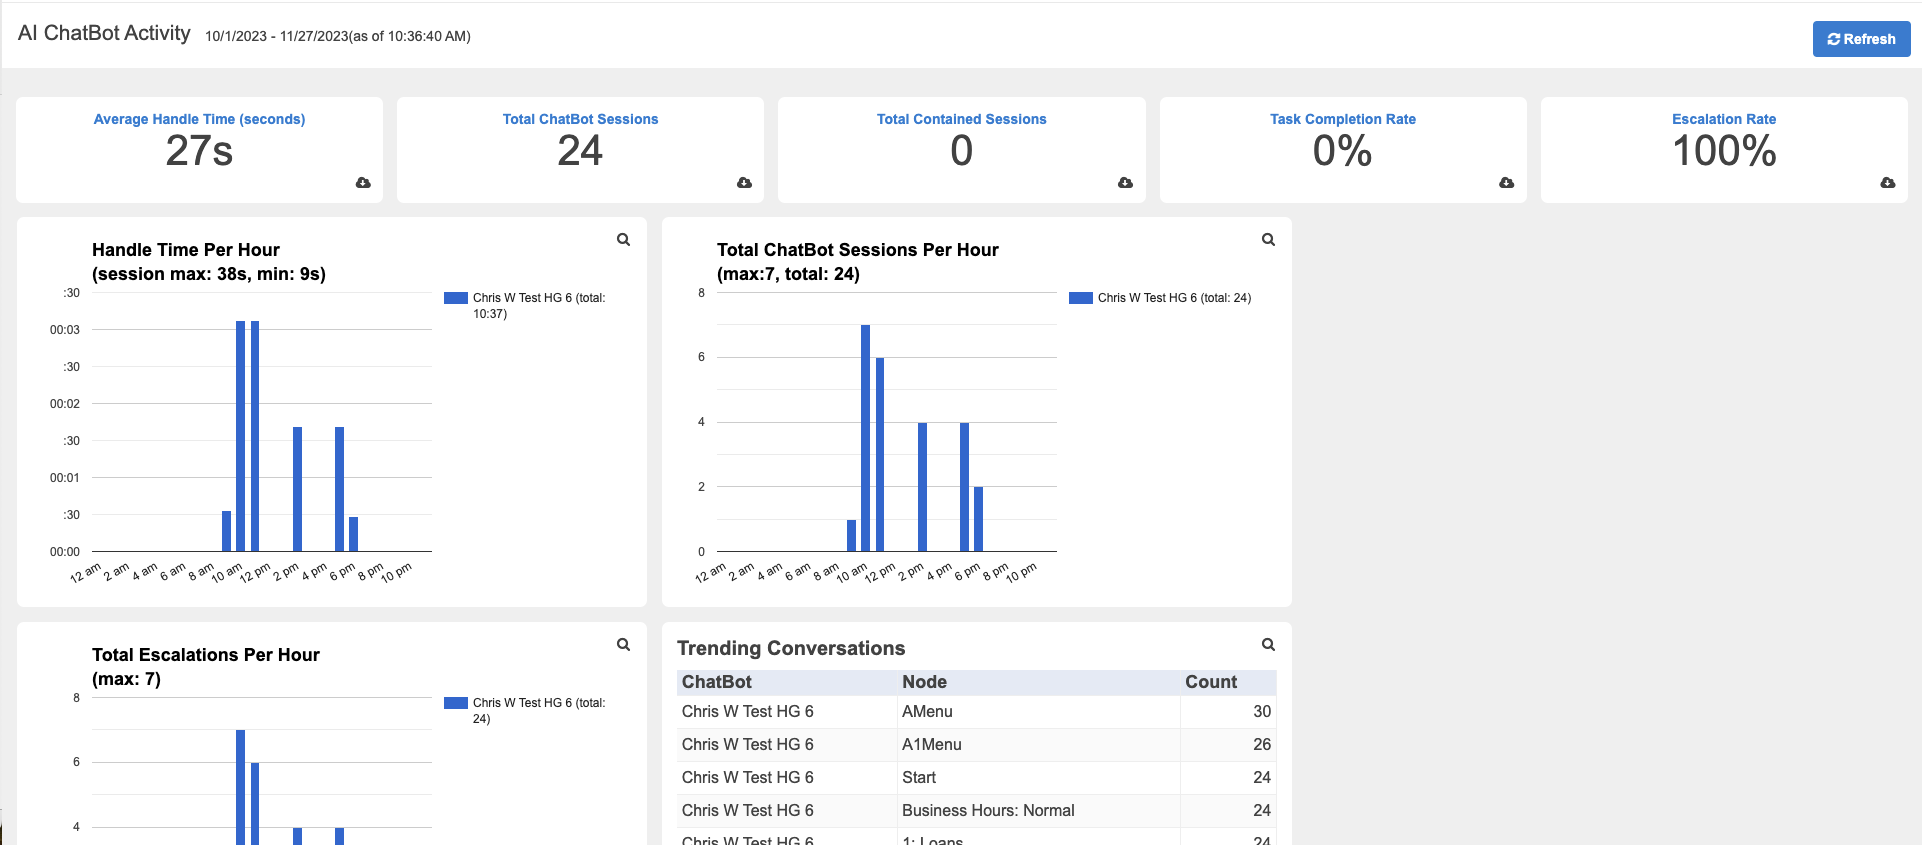
The AI ChatBot Activity dashboard can be accessed from the Menu drop-down under the Dashboards category. This dashboard display important detail about all chatbots deployed across hunt groups. Metrics respond to hunt groups filters to drill into specific hunt group performance.
Important chatbot metrics include the following
Average Handle Time (AHT)
Total ChatBot Sessions
Total Contained Sessions
Task Completion Reate
Escalation Rate
Top Metrics
Important metrics are summarized and provided to the user. These metrics reflect the selected time period. Review Applying Agent Filters for detail on how to filter down results.
Many of the hunt group specific filters will not be relevant to this view as the display is focused on activity outside of hunt group activity.
Average Handle Time (seconds)
Quickly understand the amount of time users are interacting with a ChatBot by reviewing this metric. This display will reflect current hunt group and time series filtering. Clicking the download icon in the lower right corner will export a CSV of the underlying sessions for this metric.

Total ChatBot Sessions
The total sessions initiated with the selected hunt groups chatbot during the time period. Clicking the download icon in the lower right corner will export a CSV of the underlying sessions for this metric.

Total Contained Sessions
Sessions that are initiated with a chatbot but are never routed to an agent appear in this metric. This illustrates that a bot successfully resolved the users issues. Clicking the download icon in the lower right corner will export a CSV of the underlying sessions for this metric.

Task Completion Rate
Similar to the Total Contained Sessions metric, this metric displays the % of sessions that were managed exclusively by the chatbot. Clicking the download icon in the lower right corner will export a CSV of the underlying sessions for this metric.

Escalation Rate
This metric is the inverse of the Task Completion Rate. It represents the percentage of sessions that arrived at the chatbot that were routed to an agent for completion. Clicking the download icon in the lower right corner will export a CSV of the underlying sessions for this metric.

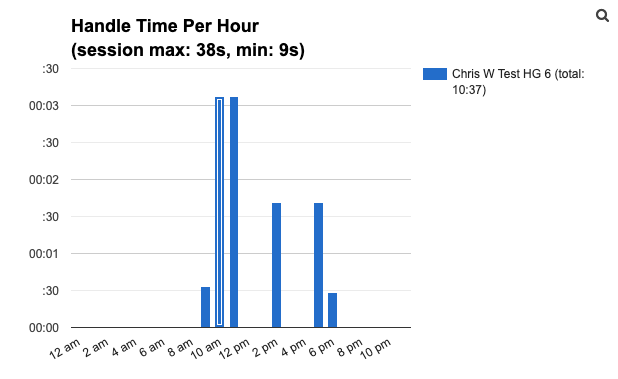
Handle Time Per Hour
Bar chart showing the average handle time of sessions occurring over the selected time period. Note that the legend dynamically shifts in granularity. In the example below, it shows 30 seconds, 1 minute, 1 minute and 30 seconds, etc
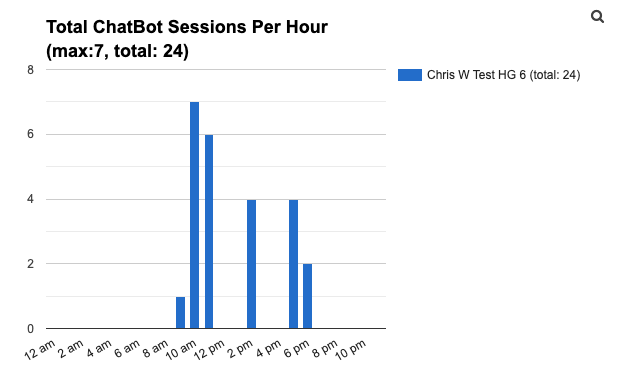
Total ChatBot Sessions Per Hour
Bar chart showing the total chatbot sessions occurring per hour over the selected time period.
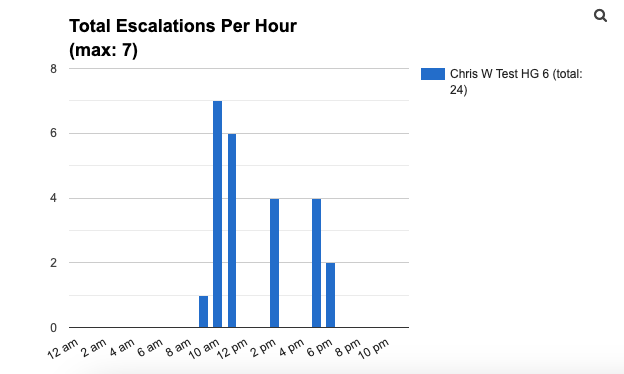
Total Escalations Per Hour
A bar chart showing the total escalated sessions occurring per hour over the selected time period.
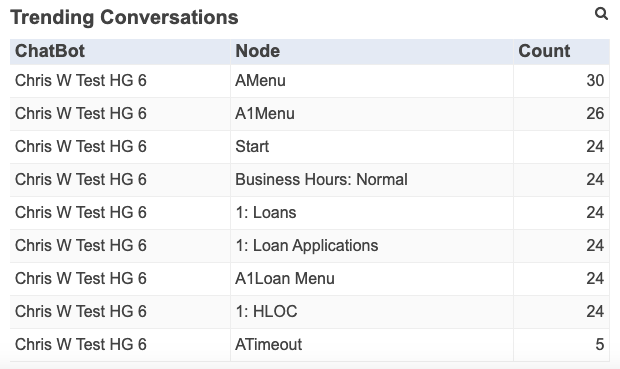
Trending Conversations
This widget displays the trending interactions within the select hunt group chatbots over the time period specified. This is useful in determining the nodes that users are interacting with most frequently that might be candidates for optimization.
