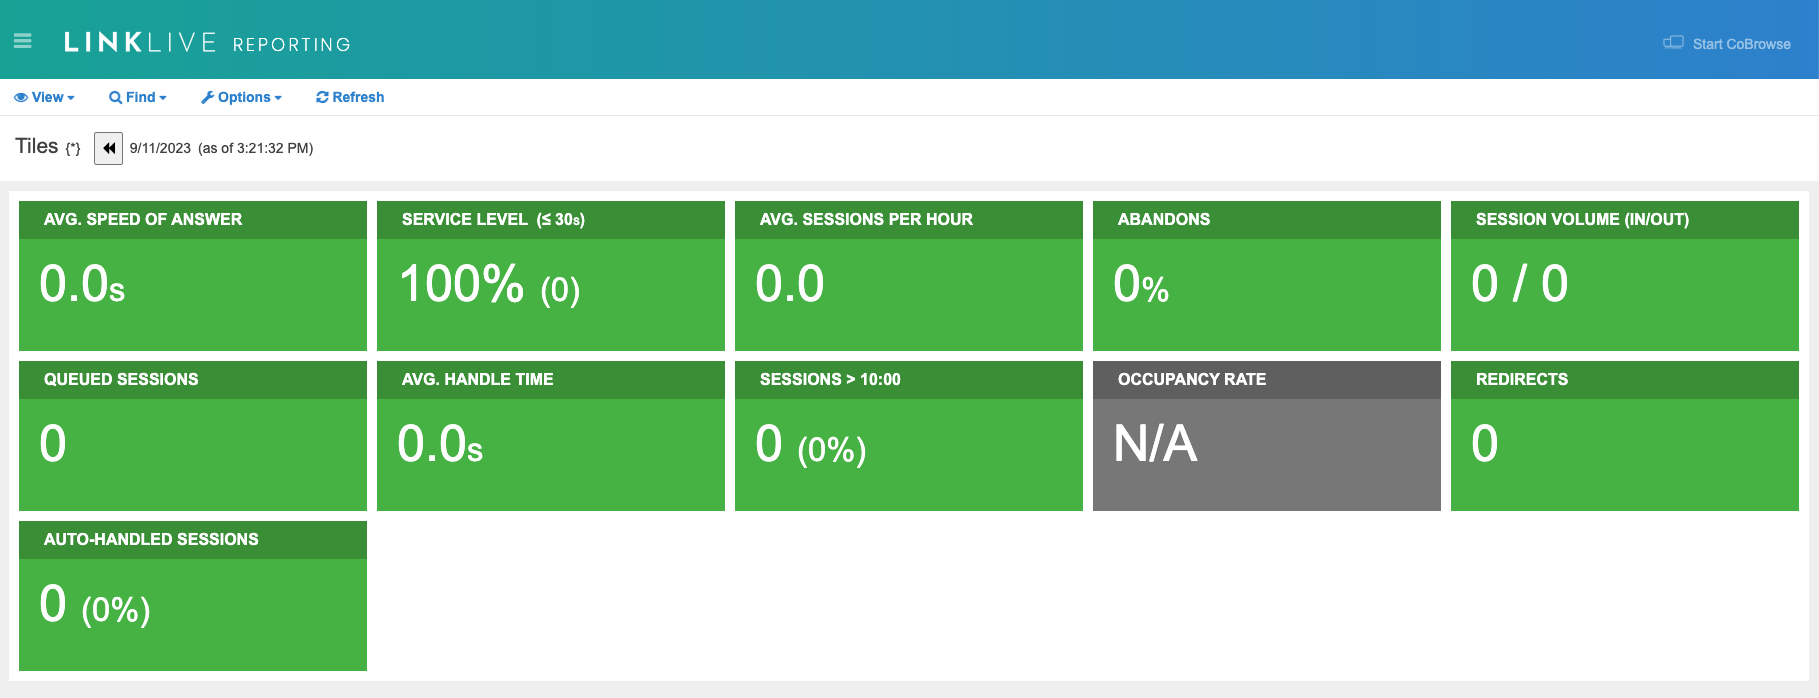
Tiles
The agent must be granted the Reporting Stats level of LinkLive Reporting access to view Tiles.
View the Tiles for your contact center by selecting Tiles from the View drop down menu at the top of the page.
The tiles listed are: Average Speed of Answer, Service Level, Average Session per Hour,
Abandons, Session Volume (In/Out), Queued Sessions, Average Handle Time, Sessions >10:00, Occupancy Rate, Redirects and Auto-Handled Sessions
Each tile is color coded to display the status of that particular metric. To meet ADA Compliance standards for color-blind agents, the Tiles now have visual indicators associated with each color. Green signifies a good or healthy metric and has no indicator, yellow signifies a warning that the metric is approaching a state that needs improvement and has a warning symbol, and red signifies that the metric is at a dangerous level with the indicator of an exclamation point.

Users have the ability to output reports in CSV format. These options can be delivered over multimedia (email, secure inbox, or file transfer).
