Charts and Graphs
The agent must be granted the Reporting Stats level of LinkLive Reporting access to view Charts and Graphs.
The Charts and Graphs view shows numerous charts detailing either the real-time or historical performance of the hunt group or hunt group grouping selected and can be accessed by clicking the View menu and selecting Charts/Graphs. The default view shows the current day’s performance since midnight that morning. An example of the default view is shown below. The default view is a static view of the time of the window being opened. You can choose to manually refresh the data by choosing Options then clicking on Refresh Now. You can also specify an automatically-refreshing view by choosing Options, then Auto Refresh and selecting the refresh frequency from the pull-down list.
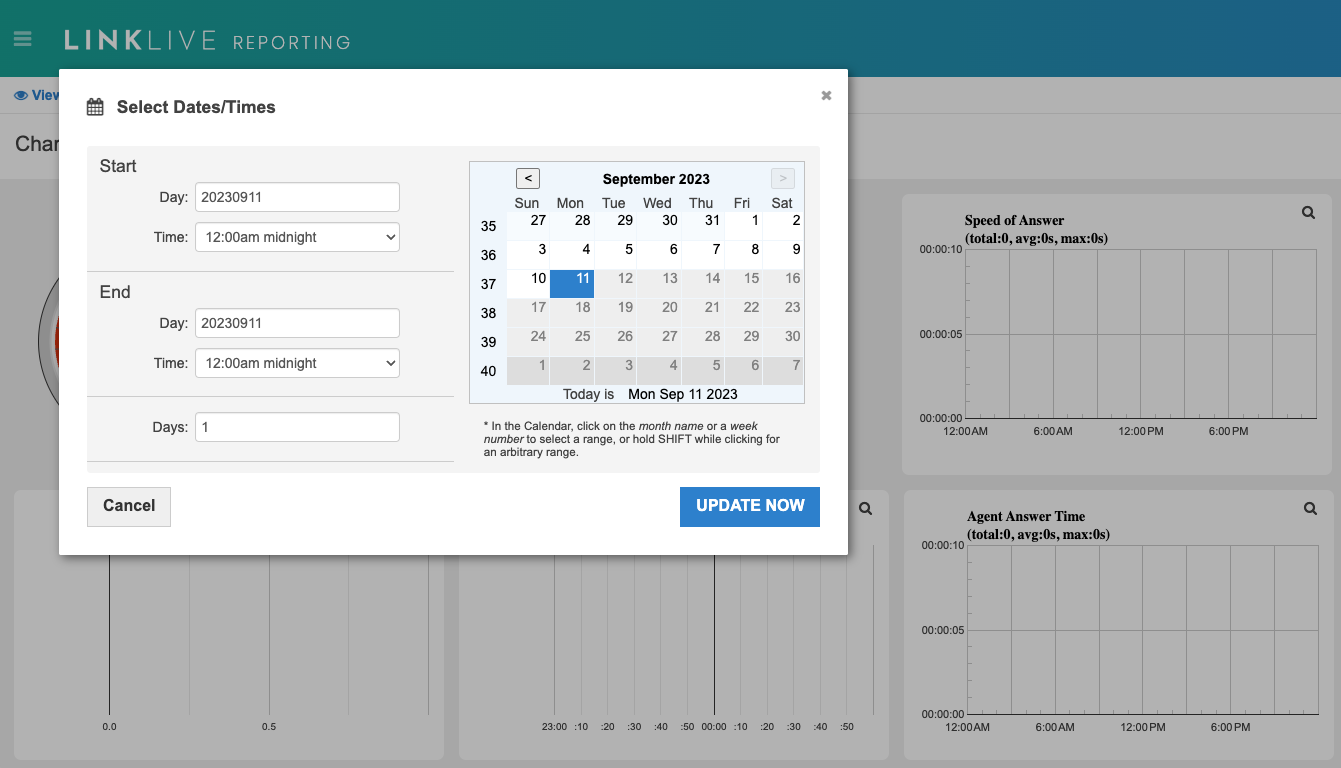
You can change the dates for which the data is shown by choosing Select Dates / Times from the Options menu. The date selection window is shown below. You can select a full week by clicking on the week number to the left of the calendar dates, you can select the entire month by clicking on the month name at the top of the selection window, or you can select a custom date range by holding the SHIFT key while clicking to select that range.

If you have chosen a Hunt Group grouping, you can further refine which Hunt Groups are displayed by choosing Options, then Select Groups. Uncheck any groups you do not want displayed and click Update Now to refresh the display.
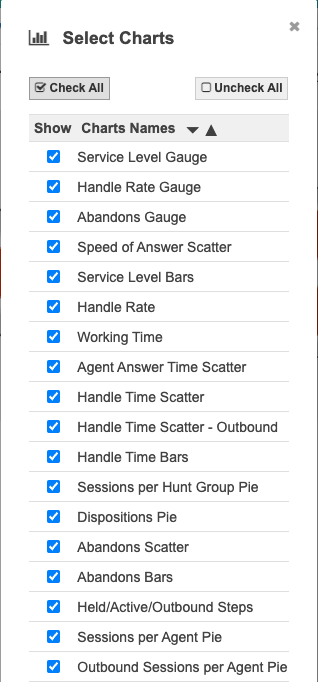
You can choose which graphs get displayed and in what order by choosing Select Charts from the Options menu. A window is displayed that shows all the charts available for the report and the order in which they are displayed. Uncheck the Show box next to a chart type to hide it. You can also re-order the sequence in which the charts are displayed by dragging and dropping them into a new order. Once you have the charts selected that wish to display and in the order you want them, click Update Now to reflect your changes.

Finally, you can select Show Data as CSV from the Options menu to display all the session information that the Advanced Reporter is using as a list of comma separated values. You can then copy this information and paste into a spreadsheet program such as Microsoft Excel to do further analysis on the data if desired.
Users have the ability to output reports in CSV format. These options can be delivered over multimedia (email, secure inbox, or file transfer).
Charts & Graphs Definitions:
Speed of Answer (Scatter): Charts each completed session by showing the time the session was queued until answered by an agent. Click a dot to view the events for that session.
Service Level (Bar Graph): Displays the number of sessions answered within each time interval.
Service Level (Gauge): Displays the percentage of sessions answered within the configured time.
Average Sessions per Hour: Calls per hour is calculated by total number of handled sessions divided by total work time of all agents.
Abandons (Bar Graph): Displays the percentage of inbound sessions that were abandoned.
Handle Rate: Displays the handle rate of each agent. Handle rate is defined as the number of sessions answered divided by the total work time (online + busy + onthephone).
Working Time: Displays the work time of each agent. Green is online, orange is busy and yellow is on the phone. Hover over the bars to view details.
Agent Answer Time (Scatter): Charts each completed session showing the time from the agent being offered the session to the agent answering the session. Click a dot to view the events from that session.
Inbound Handle Time: Charts each completed session showing the time from when the agent answered the session to when the agent left the session. Click a dot to view the events from that session.
Outbound Handle Time: Charts each outbound session showing the handle time for that session. Click a dot to view the events from that session.
Inbound Handle Time: Displays the number of sessions handled in the time interval. Hover over each bar for more detail.
Sessions per Hunt Group: Displays the number of sessions in each hunt group. Hover over a piece of the pie for more details.
Sessions per Agent (Pie): Displays the number of sessions answered by each agent. Hover over a piece of pie for more details.
Abandons (Scatter): Charts each abandoned session showing the amount of time from session start to when the session was abandoned. Click a dot to view the events from that session.
Held/Active/Outbound: Displays three area charts stacked on top of each other for sessions: Held, Active and Outbound. The peaks at any point in time represent the sum of Held + Active + Outbound.
Inbound Sessions per Agent: Displays the number of inbound sessions answered by each agent. Hover over a piece of the pie for more details.
Outbound Sessions per Agent: Displays the number of outbound sessions answered by each agent. Hover over a piece of the pie for more details.
Redirects per Agent (Pie): Displays the number of redirected sessions from each agent (RONA and ROAA). Hover over a piece of the pie for more details.
Auto-Handled Sessions (Scatter): Charts each session that was handled automatically (i.e. required no agent involvement) and shows the time from when the customer was queued to the time the session ended. Click a dot to view the events from that session.
Handled with Redirects (Scatter): Charts each handled session that contains RONA or ROAA redirects. Click a dot to view the events from that session.
Abandon with Redirects (Scatter): Charts each abandoned session that contains RONA or ROAA redirects. Click a dot to view the events from that session.
Mail Sessions per Agent Pie: Displays the number of mail messages forwarded to each agent (hover over a pie slice for more detail).
Skills Removed Pie: Displays skills that were removed during the session by count (hover over a pie slice for more detail).
