Reviewing the Forecast
Getting Started
Reviewing the Forecast
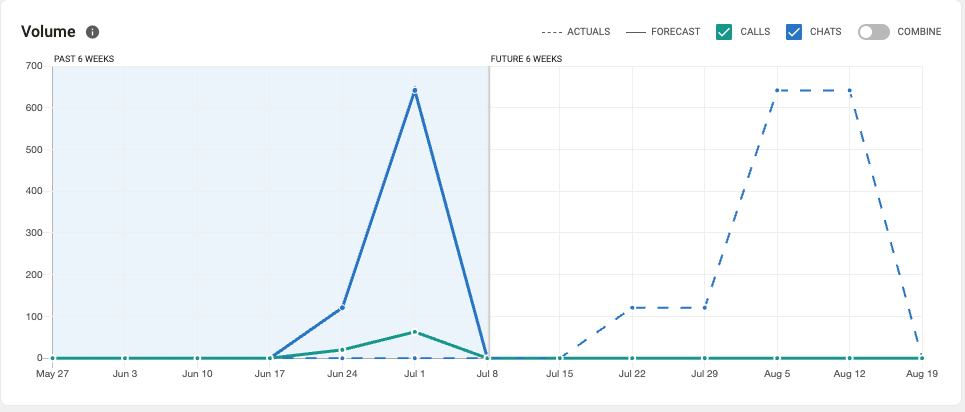
Supervisors can review historical, current, and future volume data using the volume graph. Information is broken down by calls and chats. Currently, you are able to view forecasted volumes one week into the future for resource planning.
New forecasts are generated every Sunday. Forecasts are generated for hunt groups subscribed to Workforce Management (WFM). Review the Administration section of this guide for detailed instructions on configuring your hunt group for WFM support.
How the forecast is built and predicted
The forecast is built from the previous four weeks of actual conversation activity, for chat and call conversations, and can be reviewed with chats selected, calls selected, or both selected. With every group of four weeks of historical conversation activity, the accuracy of the forecast will improve,
Using Advanced Workforce Management Features
Group & Queue Filter
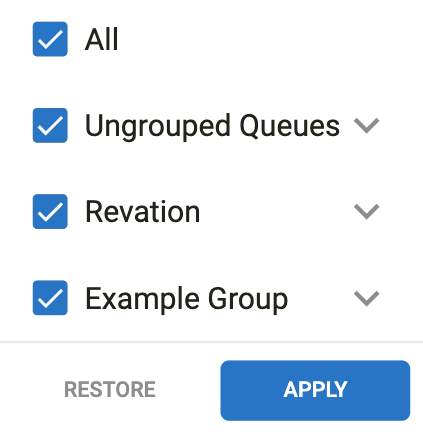
The Group & Queue filter is used to quickly filter all chats and table down to your queue of focus. To limit your view to one or more queues, click the Group & Queue filter in the top right, select one or more queues, and click Apply.
Daily / Weekly Toggle
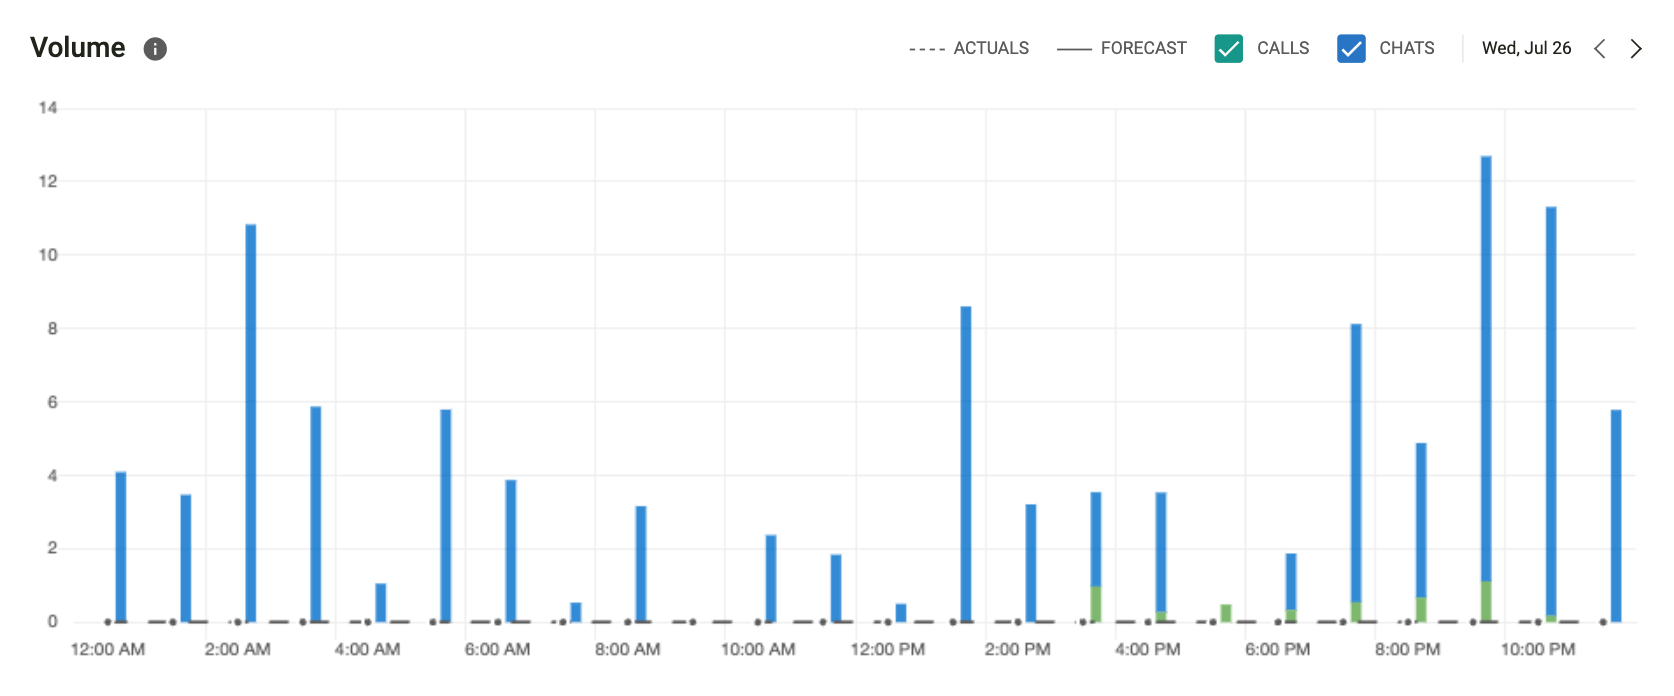
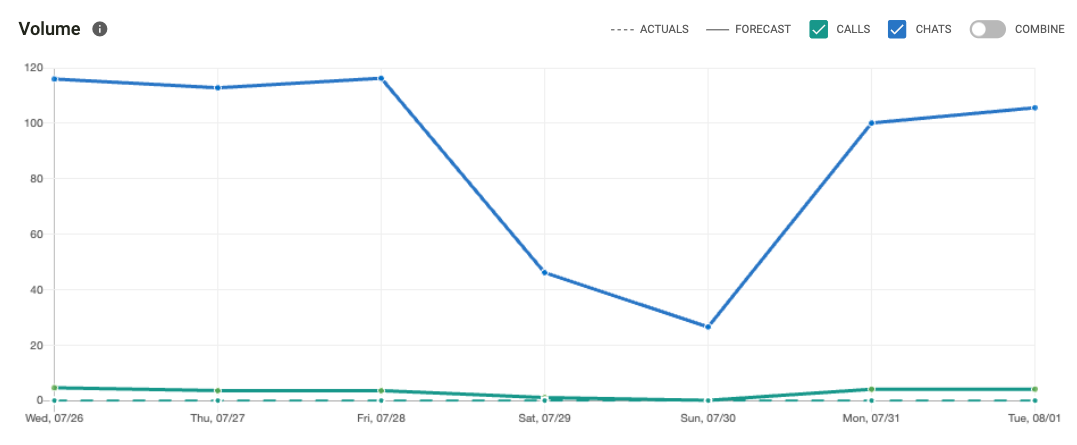
The Daily and Weekly toggle buttons are used to scope all dashboard data by day or by week. Clicking between these options will update all charts from lines to bars to accurately reflect volume.
Daily
Weekly
12 Week
Timeline Control
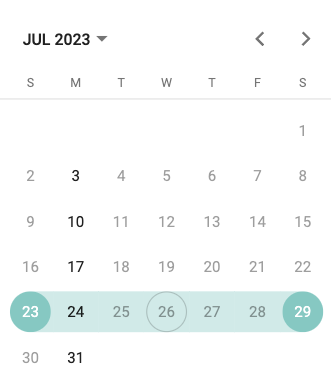
To modify the forecast view, click the date range selector located in the top left of the application.
You can select one week in the future or any previously completed week.
Using and Reviewing Charts and Monitoring SLAs
Charts
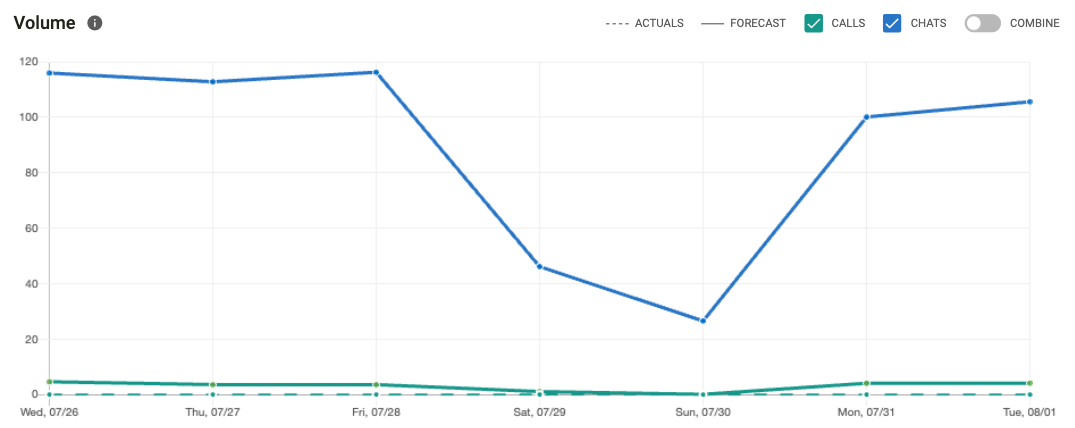
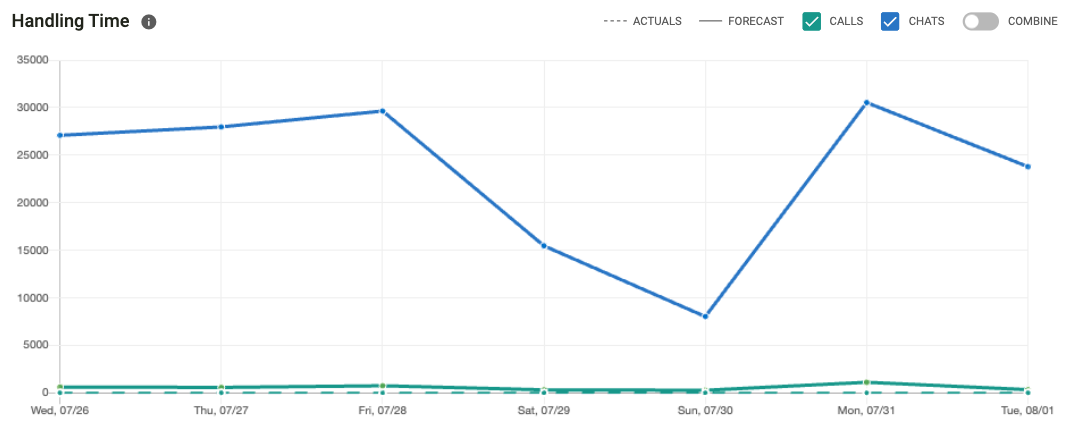
The charts on Forecast are responsive to the filter options described above. The Weekly view of Volume and Handling Time have the ability combine calls and chats into a single measure. The Daily view will show calls and chats separately as a stacked bar chart.
Volume
The Volume chart shows actual volume usage for both calls and chats. The dotted line represents the forecasted volume used to generate scheduling for that particular week.
Handling Time
The Handling Time chart shows average handle times for calls and chats by day for a particular week or day depending the filters applied. The dotted line represents the forecasted handling time for voice and chat.
Insight Cards
The forecast view contains insight cards that provide summary detail of volume per week, total handling time, and volume break downs by day.
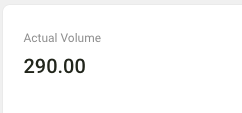
Volume per week
This insight card displays the total volume for the week selected in the Timeline Control. This card includes both calls and chats.
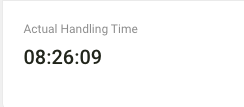
Total Handling time
This insight card displays the total handling time for the week selected in the Timeline Control. This card includes both calls and chat handling time.
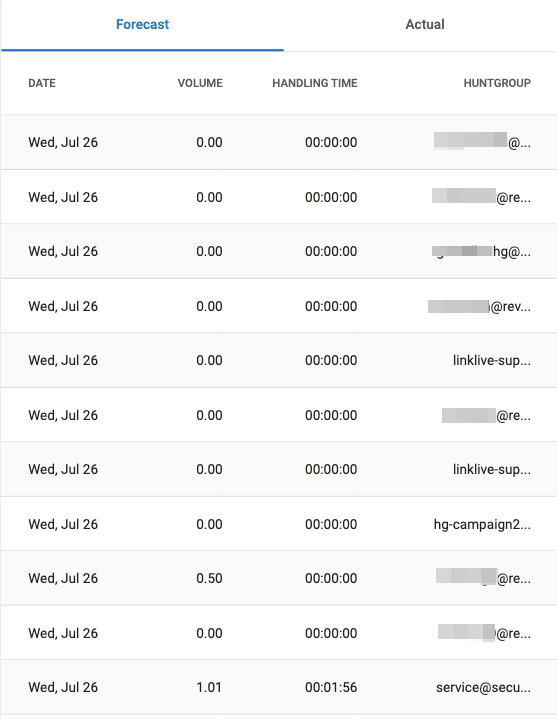
Daily Volume Insights
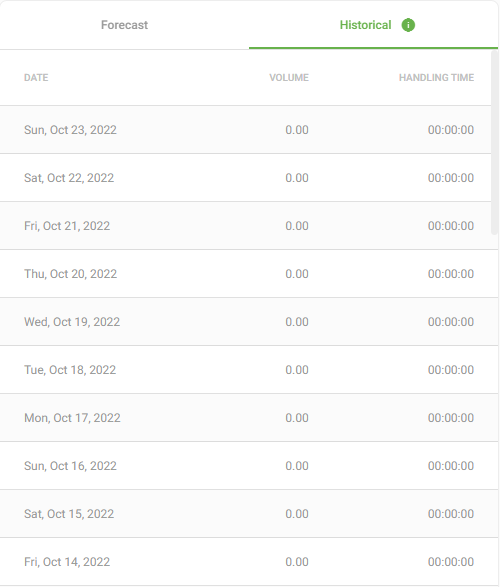
This tabular view provides visibility into call and chat volume by day. Using this insight, you can view forecasted volume amounts by day and historical volume amounts since inception.
Forecast
Historical
