Release Notes: History
LinkLive Reporting 24.01.2
Date: 2/14/24
Updates
Release Version Visibility
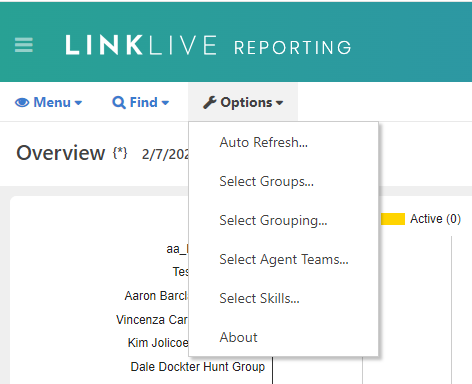
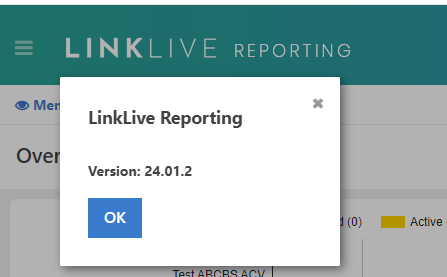
LinkLive Reporting users can now easily determine what version of LinkLive Reporting they are currently using. Simply select Options > About and the version will be shown. OK and “x” return to the previous screen.
Configure and View Service Levels by Hunt Group
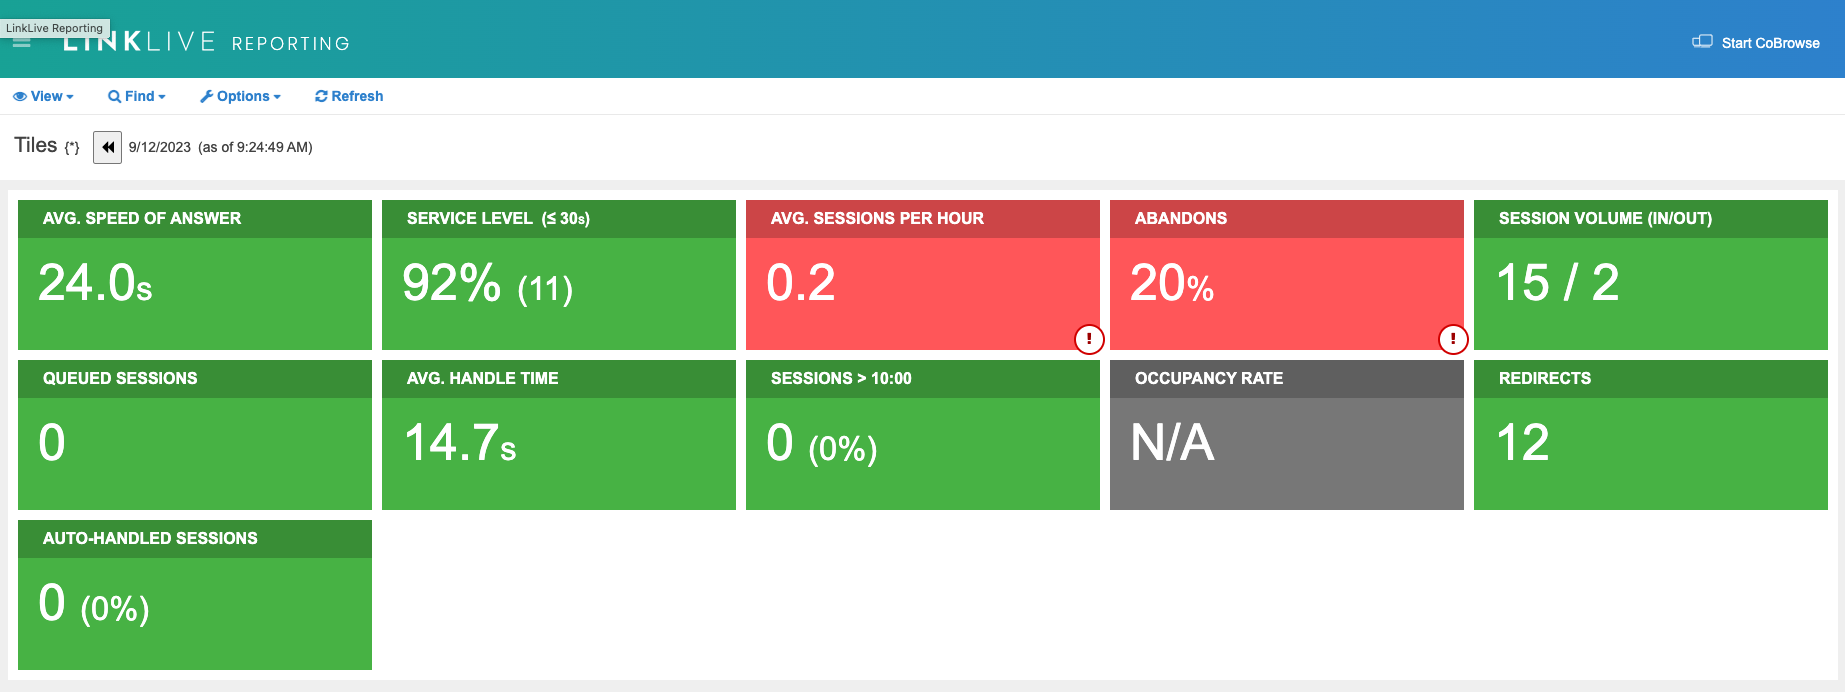
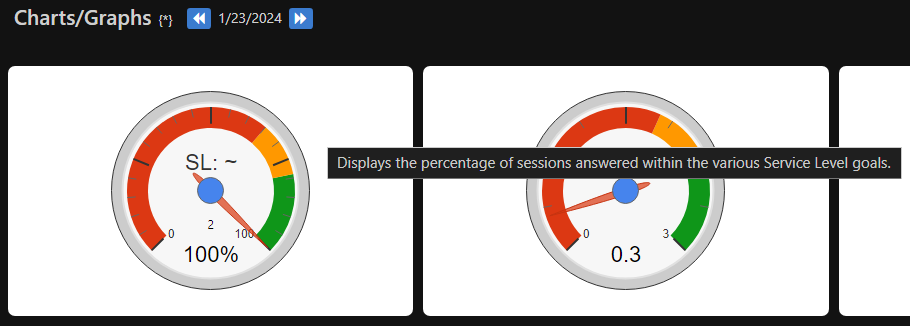
As a user of LinkLive Reporting, I may want to configure different service levels per hunt group and have the Service Level speedometer widget, in both Charts / Graphs and the Service Level tile, display the service level performance across all selected groups. Since the Service Level widget and tile currently displays the service level e.g. SL: 30s, the widget and tile will now display '~' if the service levels differ across hunt groups. Please contact LinkLive support to update the service levels in your hunt groups.

QA Evaluation Form - Print to PDF
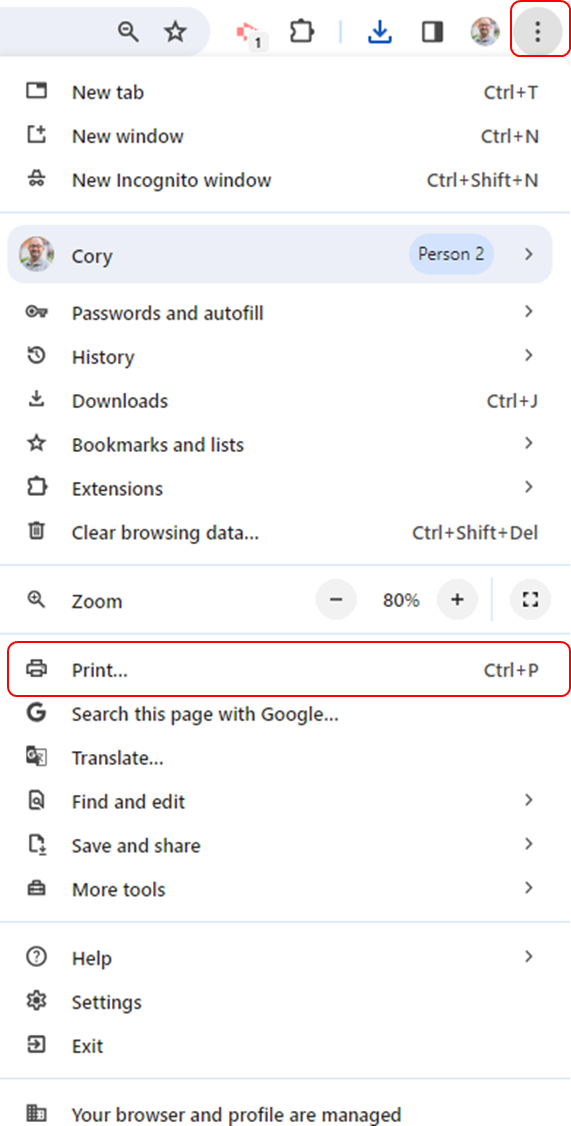
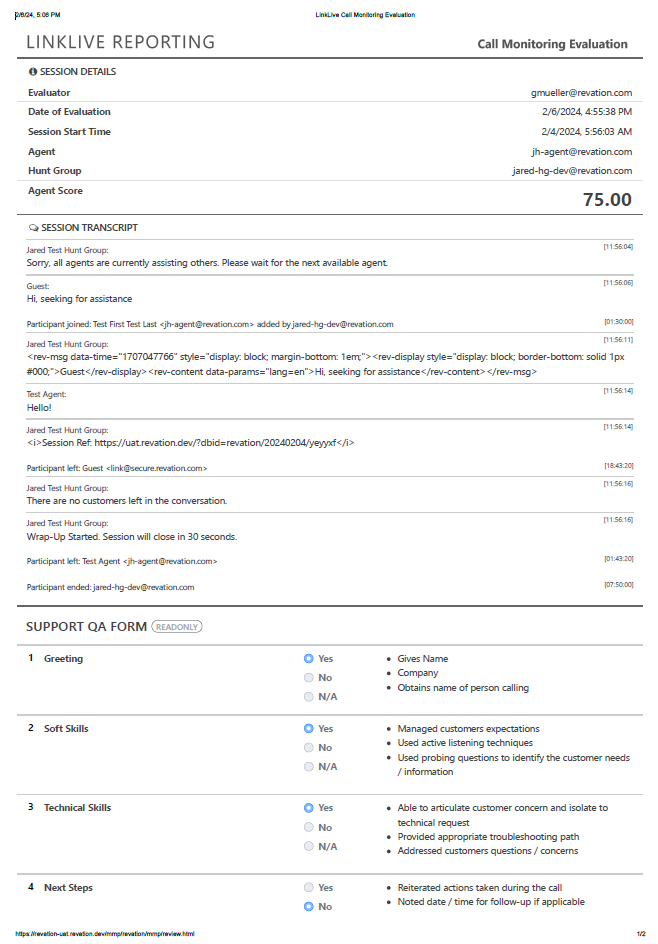
QA evaluation forms can now be printed using the browser print functionality. The screenshot below shows how to access the Print functionality in the Chrome browser as an example. Within the Print Dialog, users can choose Print to PDF as the Destination to create a PDF of the QA evaluation form.
Miscellaneous performance and bug fix updates
Past Updates
LinkLive Reporting 24.01.1
Date: January 26th, 2024
Updates
LinkLive Reporting integration to LinkLive.app along with Supervisor Join and Monitor
Users that are permissioned to access LinkLive Reports (fka MMP) and LinkLive.app can now access LinkLive Reports from a reporting icon on the left hand navigation bar of LinkLive.app. In LinkLive Reports, users can view charts, graphs, reports, and see current chat and voice sessions for chosen hunt groups in real-time. To monitor and join a session, the supervisor will click the Join Button, at which point they will join the session as a silent participant. They can choose to enter the conversation by activating the voice icon or entering a chat message.

Account Activity Chart: New Access Type by Hour Structure
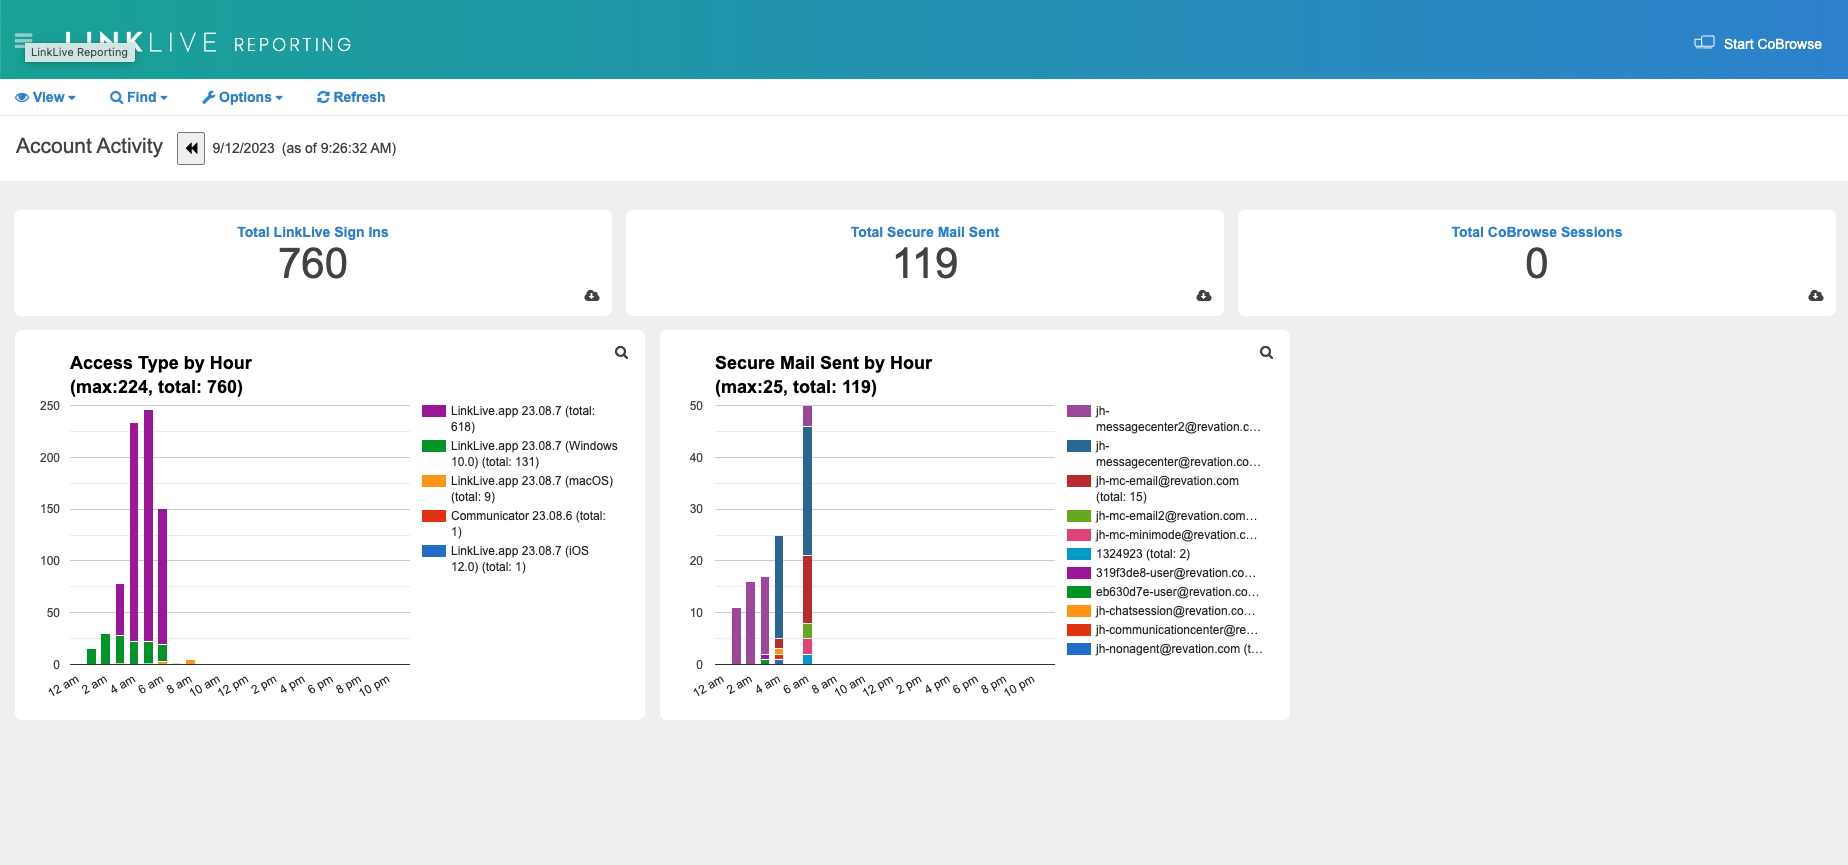
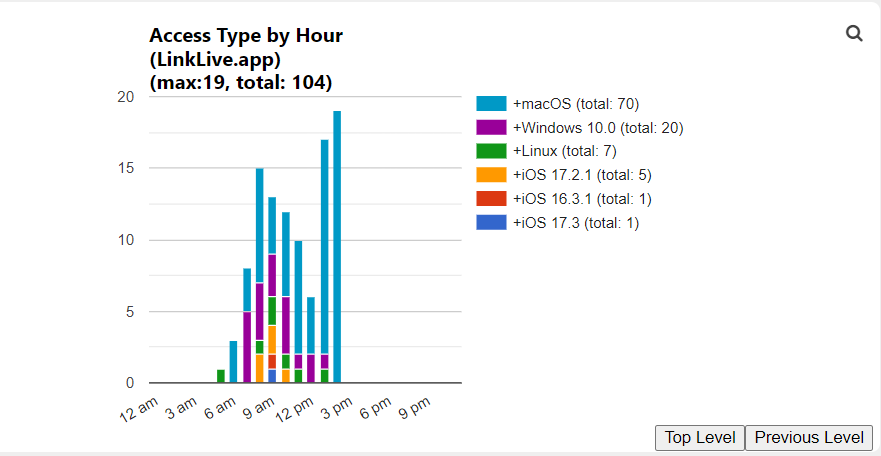
LinkLive Reporting Account Activity charts allow users to view real time statistics on LinkLive usage and access. The Access Type Chart shows number of user accesses from LinkLive.app, Communicator, or API calls. This enhancement allows user to view these high level categories and then click on the access point in the chart legend, e.g. LinkLive.app to see additional details such as which O/S and browsers are accessing LinkLive. The user can return to the Top Level view or Previous View by clicking on the corresponding button in the Chart Window.
Numerous performance and bug fix updates
LinkLive Reporting 23.11.1 (v9.6)
Date: November 6th, 2023
Updates
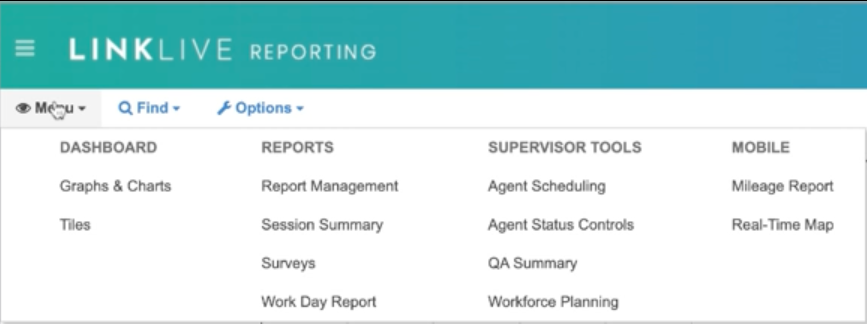
Introducing an improved navigation experience
We are excited to introduce the new navigation experience. This implementation brings all navigation items into a single large menu. This new menu is organized into categories of features that are frequently used together.
This feature is the first in a series of LinkLive Reporting UI improvements that LinkLive is excited to launch over the next several months.
Work Day Report Improvement - Custom Statuses
A frequently requested feature is the ability to see custom statuses within the workday report. LinkLive is excited to announce support for custom status reporting within the Workday Report. A user logging into LinkLive Reporting will notice the displayed columns have been expanded to include any custom statuses configured.
This is a dynamic implementation that will change to reflect the current statuses available.
Included in this improvement is the ability to hide custom statuses and return the report to the pre-release state.
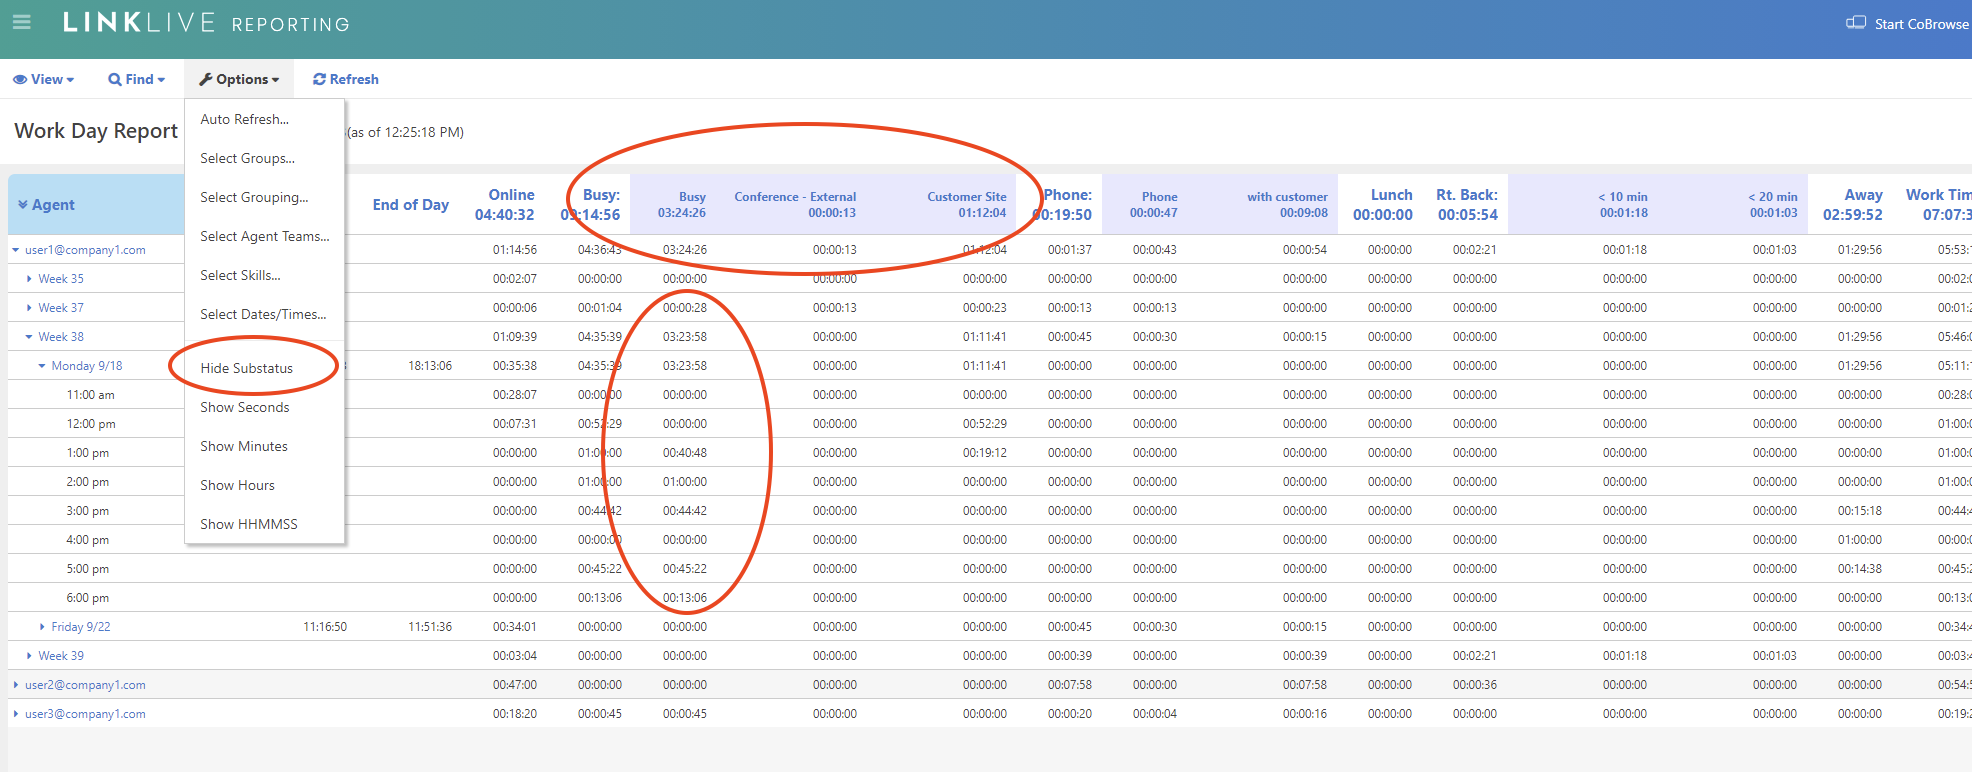
An update to Report Management is planned in a future release to bring this functionality to your business intelligence views.
LinkLive Reporting 23.09.1 (v9.5)
Date: September 25th, 2023
Updates
Introducing Account Activity Insights
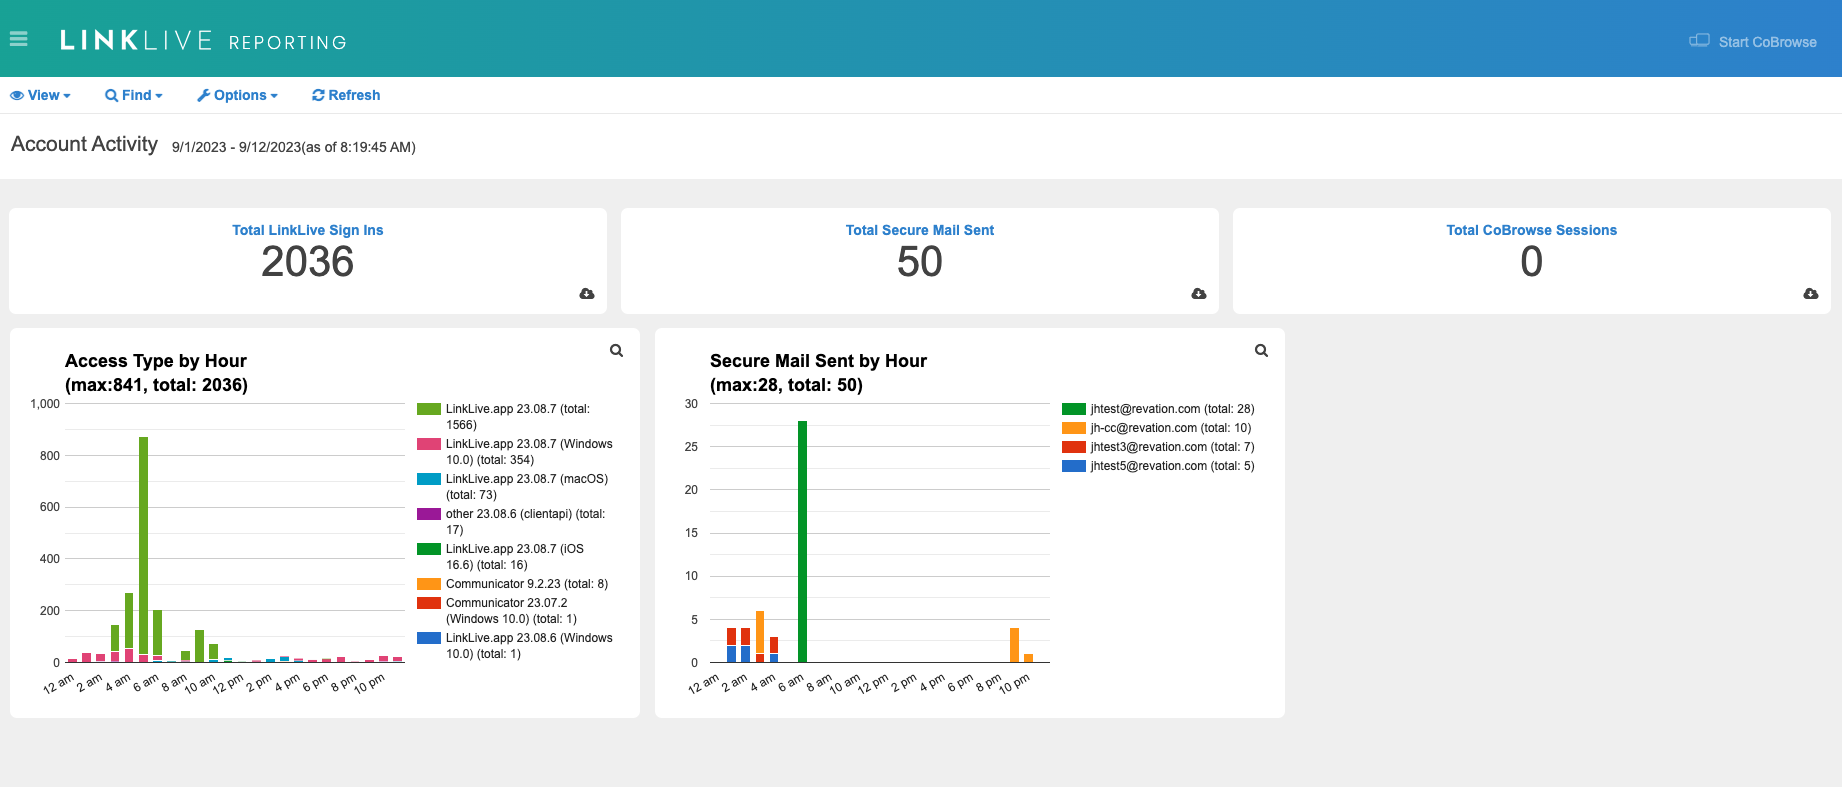
We are excited to introduce the new "Account Activity" section in LinkLive Reporting. This feature offers valuable insights into activities occurring outside of the hunt group and queue, enhancing your visibility into important account actions. Explore and stay informed with Account Activity!
User Logins
Secure Messages Sent
CoBrowse Sessions
Voice (coming soon)
Chat (coming soon)
Enhanced Visibility with AI Chatbot Activity
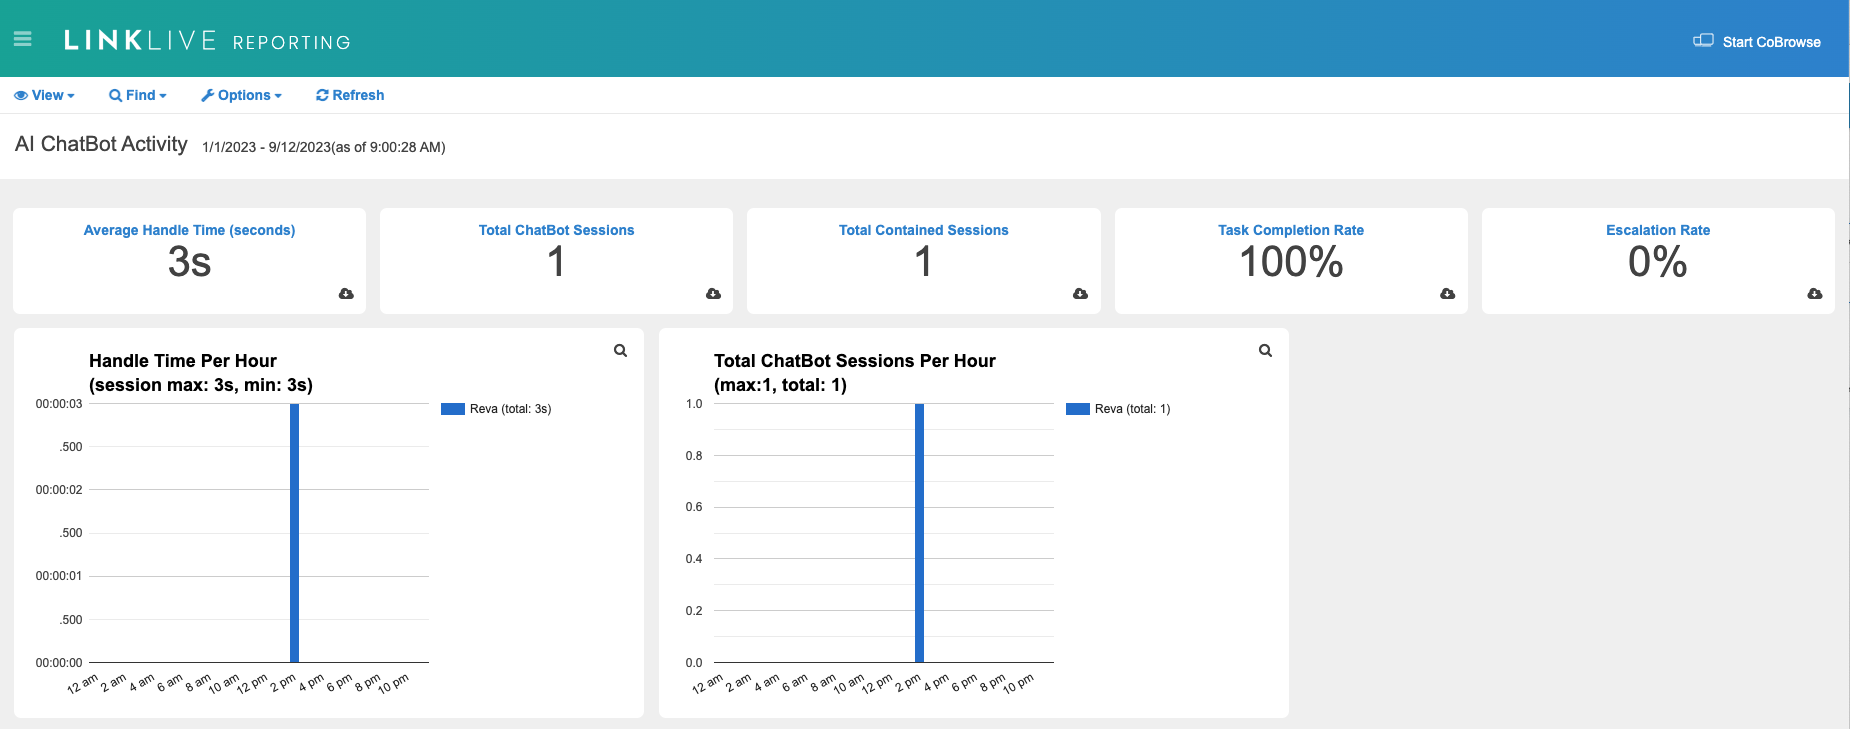
We are pleased to introduce the AI Chatbot Activity feature, which provides improved visibility into virtual assistant interactions within specific hunt groups. Users can now effortlessly filter and analyze the performance of their virtual assistant. LinkLive Reporting offers a comprehensive set of metrics, as listed and defined below, to empower your insights.
Average Handle Time - Average session duration an end user was interacting with an AI chatbot
Total ChatBot Sessions - Total sessions handled by an AI chatbot over the date range selected
Total Contained Sessions - Sessions that were not escalated to an agent.
Task Completion Rate - The percentage of sessions that were handled entirely by the AI chatbot
Escalation Rate - The percentage of sessions that were escalated to an agent
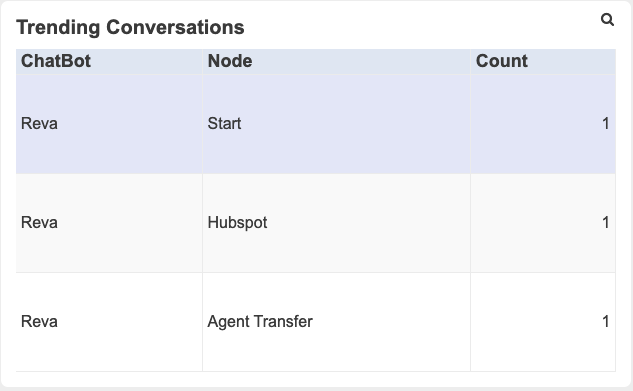
Additionally, we provide several helpful charts to gauge usage volume by hour as well as trending topics within your AI chatbot.
Enhanced Experience
Here is a refreshed reporting interface that aligns seamlessly with other LinkLive solutions. While all your insightful call center data remains unchanged, we've made subtle improvements to colors, fonts, and other LinkLive styles to enhance your overall user experience. Enjoy the updated look and feel as you continue to optimize your call center operations.
